Abstract
IBM® Data Server Manager is a web-based, integrated database management tools platform that manages IBM Db2® and IBM Db2 for z/OS® databases. With IBM Data Server Manager, you can manage and administer IBM Db2 Analytics Accelerator (Accelerator).
This IBM Redbooks® Analytics Support web document describes the various functions that are available in Data Server Manager to manage the Accelerator server.
This document is targeted at database administrators who work with IBM Db2 Analytics Accelerator. It applies to IBM Data Server Manager Version 2.1.5 and later.
Contents
IBM® Data Server Manager is a web-based, integrated database management tools platform that manages IBM Db2® and IBM Db2 for z/OS® databases. With IBM Data Server Manager, you can manage and administer IBM Db2 Analytics Accelerator (Accelerator).
This IBM Redbooks® Analytics Support web document describes the various functions that are available in IBM Data Server Manager to manage the Accelerator server.
This document is targeted at database administrators who work with IBM Db2 Analytics Accelerator. It applies to IBM Data Server Manager Version 2.1.5 and later.
Overview
This document provides an overview of all Accelerator-related management and administration functions available in IBM Data Server Manager 2.1.5. IBM Data Server Manager is a simple and intuitive database administration (DBA) tool for monitoring, administering, and tuning IBM Db2 for z/OS databases. It can be installed easily in three clicks (as a non-root user), so IBM Data Server Manager can be up and running in a matter of seconds. A web browser serves as the client that gives users access to the databases. With the ability to also manage and monitor IBM Db2, IBM BigInsights®, and cloud databases, IBM Data Server Manager has become the core of the IBM database management platform.
Unlike the existing Eclipse-based Data Studio and the Accelerator studio that need to be installed on every client workstation, IBM Data Server Manager is installed on a web server. One installation can be accessed by multiple users through a web browser. IBM Data Server Manager connects to Db2 for z/OS by using a JDBC connection through the DDF port.
IBM Data Server Manager Base Edition can be downloaded at no charge and offers limited functionality for database administration, IBM Db2 Analytics Accelerator administration, and basic query tuning functionality. Full support for query tuning and configuration management can be added with product licenses for IBM Db2 Query Workload Tuner for z/OS V5.x and IBM DB2 Configuration Manager V4.1.x. Additional advanced capabilities for Db2 for z/OS users are available as one-time charge (OTC) offerings from various Db2 for z/OS tools and solutions.
Summary
The document provides an overview of these topics:
- Installation of IBM Data Server Manager
- IBM Db2 Analytics Accelerator administration
- Table and Query Dashboard for Accelerator
Installation of IBM Data Server Manager
Complete these steps to install IBM Data Server Manager:
- Run setup.bat (Windows) or setup.sh (Linux), which are located in the ibm-datasrvrmgr directory.
- Provide a user ID and a password to administer the product. This user ID is independent of the operating system user ID.
- When the installation is complete, open a web browser and enter the following line in the address field to log in to the IBM Data Server Manager web user interface:
https://server_host_name_or_ip:https_port
After you have logged in successfully, you can add a database for IBM® Db2® Analytics Accelerator administration. Figure 1 shows how to add a database connection to IBM Db2 for z/OS.

Figure 1. Manage Connections Menu
Figure 2 shows how to add database connection information, which is required to administer paired IBM Db2 Analytics Accelerators.

Figure 2. Add Database Connection page
Figure 3 shows where to provide the credentials that enable IBM Data Server Manager to communicate with the database. If the DBA wants the connection to be shared by multiple users based on the company policy, the DBA saves credentials to a repository, as shown in Figure 3. When credentials are saved to a repository, multiple users can connect with the saved credentials. If the DBA does not save the credentials, users who log into IBM Data Server Manager are prompted to enter their IBM RACF® credentials.

Figure 3. Add connection credentials
Establish a test connection to make sure that the provided credentials are correct. If the test connection is successful, save it by clicking Yes.
Click the Home option in the collapsible menu on the left to see the newly added connection in the grid. If it does not show, click the Refresh button at the top right. Figure 4 shows the Home page grid and the Refresh button.
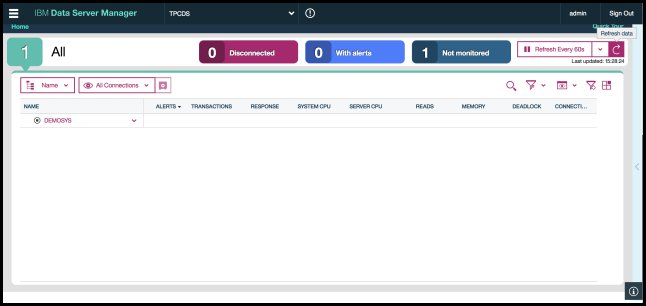
Figure 4. Home page
From the connection picker on the top bar, select the database connection, as shown in Figure 5.
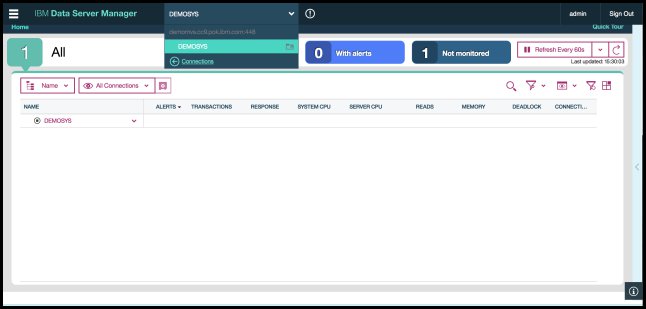
Figure 5. Selecting the database connection from the connection picker
IBM Db2 Analytics Accelerator administration
Figure 6 shows the menu item for IBM Db2 Analytics Accelerator administration.

Figure 6. Accelerators menu
Selecting Administer -> Accelerators opens the Accelerator Dashboard, which lists all the Accelerators that are paired to a Db2 for z/OS subsystem. If an Accelerator is selected in the grid, information about that Accelerator is displayed in the Accelerator Dashboard as shown in Figure 7.

Figure 7. Accelerator Dashboard
From the Accelerator Dashboard, the Accelerators can be started or stopped. In addition, new Accelerators can be paired, and existing Accelerators can be unpaired or removed. Furthermore, a selected Accelerator can be managed. The option to manage Accelerators is described in more detail in the upcoming sections.
Figure 8 shows the details for the selected Accelerator.

Figure 8. Accelerator details
From the Accelerator Details panel, the following activities can be started:
- Setting the tracing level for Accelerator stored procedures and the Accelerator server.
- Saving traces to the local system or, by using FTP, transferring it directly to a problem management record (PMR), as shown in Figure 9.
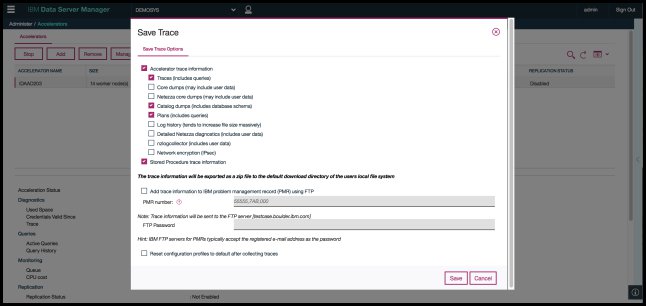
Figure 9. Options for collecting and saving traces
- Updating credentials and viewing encryption and certificate details.
- Starting and stopping incremental updates (replication) and viewing all replication-related events (Figure 10).
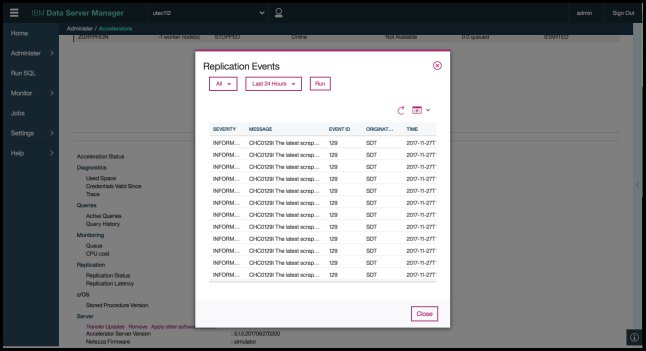
Figure 10. Viewing replication events
- Applying a different software version to the Accelerator server, removing a specific software version, and transferring software updates.
Table and Query Dashboard for Accelerator
If you click Manage for any selected Accelerator, you open the Tables/Queries dashboard.
Figure 11 shows the table dashboard for the selected Accelerator with the various actions that are currently supported for tables.
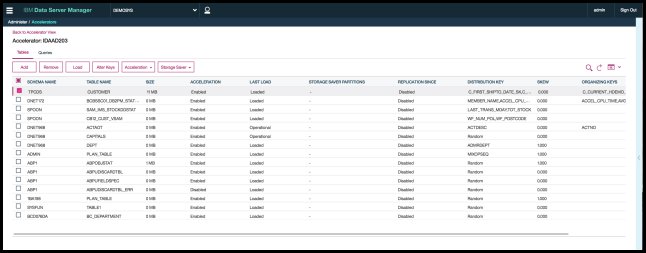
Figure 11. Table Dashboard with supported actions
The Add Tables option is always enabled. The dashboard lists all the tables that have been added to the Accelerator. Their current acceleration status is shown, along with the table size, the data load status, distribution and organization keys, the skew value, and the replication status.
Figure 12 shows how to add table references to an Accelerator. The list also highlights table columns that are not supported by the Accelerator. The Search option allows filtering the grid based on schema name and table name for easy access.

Figure 12. Table Add dialog
After a list of table references has been added, data can be loaded into these tables on the Accelerator, as shown in Figure 13. When a table reference is selected in the dashboard grid, the Load action is enabled. Clicking Load opens the Load Data dialog, which shows the partition status and load recommendations for the table.

Figure 13. Load Data dialog
Figure 14 shows how distribution and organizing keys can be selected for a table to improve query performance.

Figure 14. Alter Distribution and Organizing Keys dialog
Figure 15 shows how table partitions can be archived from the Accelerator.

Figure 15. Move Storage Saver Partitions to Accelerator dialog
Figure 16 shows how table partitions can be restored from the Accelerator.

Figure 16. Restore Storage Saver Partitions to Db2 dialog
The List Tasks and Cancel Tasks dialog shown in Figure 17 enables users to cancel any currently running task.

Figure 17. List/Cancel Tasks
Tables in the Accelerator might no longer be in sync with base tables in Db2 for z/OS when there are structural changes to the base tables. These changes include altering the data type of a column, adding a new column, and so on. The Synchronize Schema for Tables dialog shown in Figure 18 enables users to synchronize Accelerator-shadow tables that went out of sync.

Figure 18. Synchronize Schema for Tables dialog
The Query Dashboard shows the status of all accelerated queries including important performance statistics. For each selected query, the full SQL text can be viewed. The query can be prepared for a rerun by posting it to the SQL Editor, and a Post Explain can be performed. The option to list and cancel running queries is always available on the dashboard, as shown in Figure 19.

Figure 19. Query Dashboard
Figure 20 shows the entire SQL text for a select query.

Figure 20. Show full SQL text
Figure 21 shows the post-execution Explain graph for a query.

Figure 21. Post-execution Explain graph
Figure 22 shows the SQL editor prepared to rerun a selected query that was run on the Accelerator previously.

Figure 22. SQL editor prepared for query
The button to list and cancel queries is enabled on the Query Dashboard when there are queries that are in running state. This option, as shown in Figure 23, gives users the ability to list and cancel currently running queries.

Figure 23. List/cancel queries
Useful links
- IBM Db2 Analytics Accelerator for z/OS documentation
https://ibm.co/2BmhZb8 - IBM Db2 Analytics Accelerator for z/OS product support
https://ibm.co/2AkddeI - IBM Data Server Manager at IBM Knowledge Center
http://www.ibm.com/support/knowledgecenter/SS5Q8A/product_welcome.html - IBM Data Server Manager community
https://ibm.biz/dataservermanager
Others who read this also read
Special Notices
The material included in this document is in DRAFT form and is provided 'as is' without warranty of any kind. IBM is not responsible for the accuracy or completeness of the material, and may update the document at any time. The final, published document may not include any, or all, of the material included herein. Client assumes all risks associated with Client's use of this document.
